Reports and Output Windows
Reports turn explicitly collected project clips and presentation rows into coaching tables and supported data exports.
Choose, calculate, then verify
Pick the source, filters, grouping, and metrics first. Reports calculate only when you ask, so verify a small known set before exporting a full result.
Summary Reports
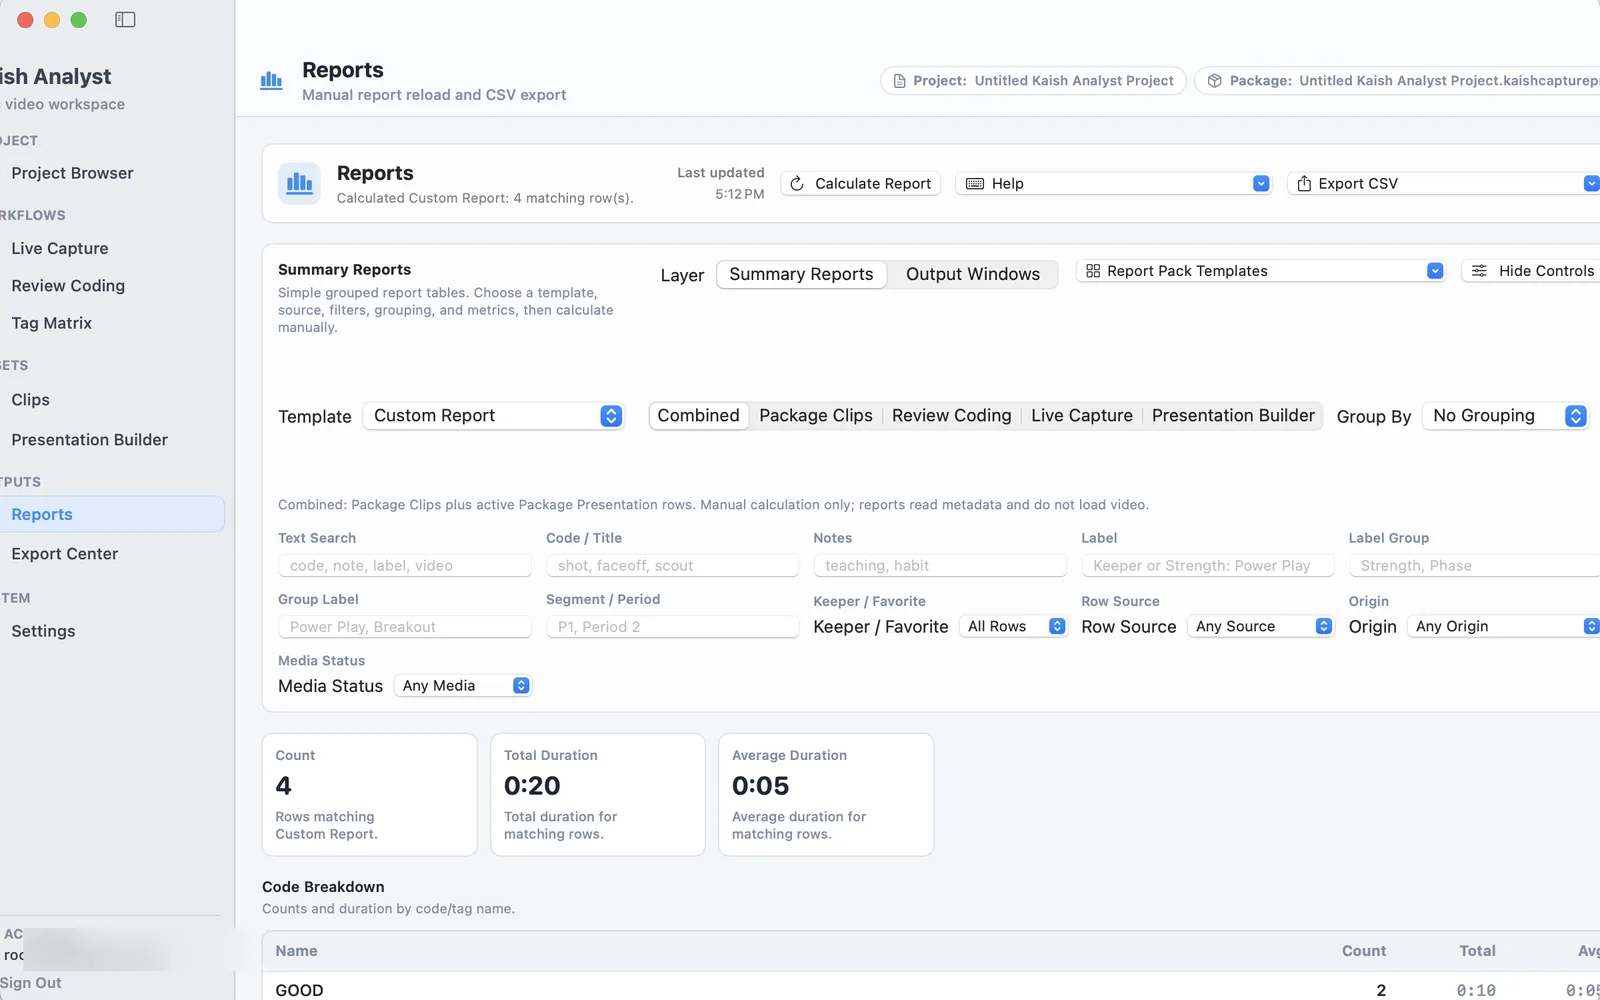
Summary Reports are grouped report tables for counts, breakdowns, source summaries, label summaries, and keeper/favorite views.
- Open Reports.
- Choose Summary Reports.
- Pick a starter template or configure source, filters, group, and metrics.
- Click Calculate Report.
- Export CSV if needed.
Reports calculate on demand. They do not run automatically on startup.
Output Windows
Output Windows are custom count/duration matrix tables for situations by result, labels by code, or other row/column combinations.
- Open Reports.
- Choose Output Windows.
- Pick or configure a matrix definition.
- Click Calculate Matrix.
- Review row totals, column totals, and grand total.
- Export CSV if needed.
Sources and player data
Reports use stored project clips and rows from the active presentation context. Review and Live Capture rows appear only after you explicitly add them to the intended project clip collection or focused presentation; opening a row does not silently add it to Reports.
Player and on-ice outputs appear when tagged rows include player metadata. The app does not invent roster participation or on-ice calculations from generic labels.